How to measure marketing roi: A Practical Guide to Proving Real Revenue
Here’s how you can start measuring your marketing ROI and prove the value of every dollar you spend.
It all boils down to a pretty straightforward formula: take the revenue you generated from marketing, subtract what you spent, and then divide that number by your total cost. The result gives you a clean percentage that shows exactly how much value your marketing is creating.
Setting Up Your Framework to Measure Marketing ROI
Before you can crunch any numbers, you need a solid foundation. Figuring out your marketing ROI is less about complex math and more about setting up a clear system that connects your marketing activities to actual business results. Think of it as the ultimate metric for proving your team's worth and justifying next year's budget.
Forget the vanity metrics like likes and shares. Real ROI measurement is about tying every single campaign directly to the bottom line. The classic formula is your starting point: (Revenue - Cost) / Cost. It looks simple on the surface, but the real work is in accurately defining what goes into "Revenue" and "Cost." Nail that, and you'll be speaking the language the C-suite understands best: money.
Why Tracking Marketing ROI Isn't Optional Anymore
In today’s business climate, every dollar is under a microscope. Marketing isn’t just a creative department anymore; it’s a revenue engine that has to prove its worth. The pressure is on, and the data backs it up. A staggering 83% of marketing leaders now say that demonstrating ROI is their absolute top priority, a huge jump from just 68% five years ago. This shift shows just how intense the scrutiny has become amid tightening economic conditions. You can dig into more of these trends in these marketing effectiveness findings from USD Analytics.
When you track ROI effectively, you can:
- Justify Your Spend: Show the leadership team exactly how their investment is paying off.
- Optimize Your Strategy: Pinpoint which channels and campaigns are crushing it so you can double down on what works.
- Secure Bigger Budgets: Nothing argues for more resources like hard data that proves your success.
- Make Smarter Decisions: Ditch the guesswork and start making data-driven choices about where to put your time and money.
At its core, measuring marketing ROI is all about accountability. It's how you transform your department from a perceived cost center into a proven profit generator.
What Really Goes into the ROI Formula?
To get a true ROI figure, you have to be meticulous about what you count as "Revenue" and "Cost." One of the most common mistakes I see is people overlooking hidden expenses or misattributing sales, which completely skews the final number.
H3: Defining Your Marketing Cost
Your total marketing cost is way more than just your ad spend. For a truly accurate picture, you need to include every related expense.
- Direct Campaign Costs: This is the obvious stuff—ad spend on platforms like Google Ads or Meta, event sponsorship fees, and printing costs for physical materials like your QR code stickers.
- Tech & Software: Don't forget the monthly or annual subscriptions for your CRM, marketing automation platform (like HubSpot or Marketo), analytics tools, and any design software.
- People Power: Factor in the salaries of your marketing team. If you're using freelancers or agencies, include their fees here, too.
- Content Production: Remember to account for any costs tied to creating blog posts, videos, graphics, or other assets.
H3: Pinpointing Your Marketing Revenue
Attributing revenue correctly is often the trickiest part of the equation. It demands a clear, trackable line between a marketing touchpoint and a customer's purchase. This is where tools like UTMs and unique landing pages, which we’ll cover in a bit, become your best friends.
Revenue isn’t always a direct sale, either. Depending on your business model, you might measure it through the dollar value of new leads generated or even the total lifetime value of customers brought in through a specific campaign.
Before we dive deeper, let's get a handle on the key terms you'll be using. This table breaks down the essential metrics that form the backbone of any solid ROI calculation.
Essential Marketing ROI Metrics at a Glance
| Metric | What It Measures | Why It's Important |
|---|---|---|
| Marketing Revenue | The total sales or value generated directly from marketing activities. | This is the "return" part of ROI; it's the direct financial outcome of your efforts. |
| Marketing Cost | The total expense of all marketing efforts, including ads, tools, and labor. | This is the "investment" part of ROI; accuracy here is key to a true calculation. |
| Customer Acquisition Cost (CAC) | The average cost to acquire one new customer. | Helps you understand the efficiency of your campaigns and channels. |
| Customer Lifetime Value (CLV) | The total projected revenue a customer will generate over their entire relationship with you. | Puts acquisition costs into perspective and highlights the long-term value of your marketing. |
| ROI Percentage | The net return on your marketing investment, expressed as a percentage. | The ultimate bottom-line metric for proving marketing's financial contribution. |
Having these definitions handy will make it much easier to have clear, data-driven conversations about performance with your team and with company leadership.
The Power Couple of Marketing Metrics: CAC and CLV
Two KPIs that feed directly into your ROI analysis are Customer Acquisition Cost (CAC) and Customer Lifetime Value (CLV). Getting a handle on these gives you a much deeper, more strategic view of how your marketing is really performing over the long haul.
Customer Acquisition Cost (CAC): This metric tells you, on average, exactly how much it costs to win a new customer. You get this number by dividing your total marketing and sales spend by the number of new customers you brought in over a specific period. A low CAC is a sign of efficient, well-targeted marketing.
Customer Lifetime Value (CLV): This is a prediction of the total profit your company can expect to make from a single customer throughout their entire journey with you. A high CLV means you’re not just attracting anyone; you’re attracting and keeping valuable, loyal customers.
The real magic happens when you look at these two together. The relationship between CAC and CLV reveals the long-term financial health of your marketing engine. A healthy, sustainable business model typically has a CLV that is at least three times greater than its CAC. This simple ratio proves you aren't just acquiring customers; you're acquiring them profitably.
Building Your Data Collection and Tracking Systems
Trying to measure marketing ROI without a solid data foundation is like trying to navigate a ship in a storm without a compass. You’re just guessing. Accurate measurement isn't born from a fancy dashboard; it’s built from the ground up with clean, reliable data.
Think of it this way: your marketing campaigns are sending out signals. Your job is to set up the right antennas to catch those signals and trace them back to the source. This infrastructure is what turns vague activity into hard revenue data you can actually use.
Mastering UTM Parameters for Crystal-Clear Tracking
The most fundamental tool in your tracking toolkit is the UTM parameter. Honestly, a consistent UTM strategy is non-negotiable if you're serious about this stuff. These are just simple bits of text added to the end of a URL that tell your analytics platform, like Google Analytics, exactly where a visitor came from.
Imagine you're pushing a new product. You share the link on Facebook, in an email newsletter, and through a paid influencer. Without UTMs, all that traffic gets lumped together as "direct" or "social." You're left completely blind as to which channel is actually making you money.
Here’s how to structure them for total clarity:
- utm_source: This identifies the platform, like
google,facebook, ornewsletter. - utm_medium: This is the marketing medium, such as
cpc,social, oremail. - utm_campaign: This names your specific campaign, like
spring_sale_2024. - utm_term: This is for tracking specific keywords in a paid search campaign.
- utm_content: This helps differentiate ads or links pointing to the same URL, like
blue_buttonvs.text_link.
My best advice? Create a shared spreadsheet that dictates your company's UTM naming conventions. It’s a simple step that saves countless hours of data cleanup later. Consistency is everything here, so enforce it ruthlessly.
This whole process boils down to a simple flow: figure out your costs, track the revenue that comes in, and then do the math.
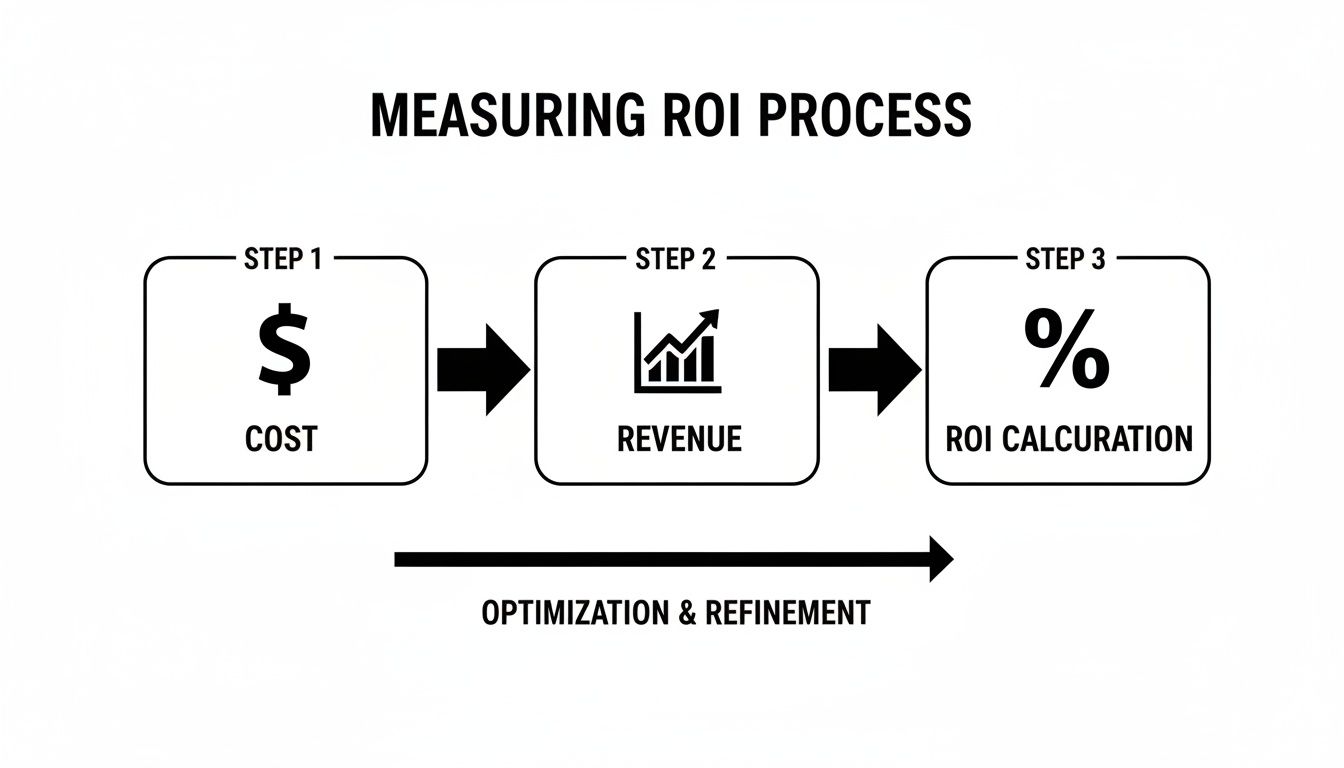
It’s a systematic process, not just a one-off calculation.
Beyond UTMs: Creative Tracking Solutions
While UTMs are the gold standard for digital links, they can't cover every single scenario. You'll need to get a bit more creative to capture data from every corner of your marketing mix, especially when you’re trying to connect offline actions to online results.
Unique Landing Pages
Instead of dumping all your campaign traffic onto your homepage, build dedicated landing pages. Let’s say you’re sponsoring a trade show. Just spin up yourwebsite.com/tradeshow2024. Any traffic and conversions coming through that page are automatically tied to the event. No UTMs needed, and the data is squeaky clean.
Campaign-Specific Discount Codes
This one is a classic for a reason—it works flawlessly. Just offer a unique discount code for each channel. Think "PODCAST20" for a podcast ad or "EVENT15" on a flyer from a conference. When a customer punches in that code at checkout, you have a direct, undeniable link between that specific marketing effort and a sale.
Bridging the Offline-to-Online Gap with QR Codes
For any business with a physical footprint, the biggest headache is often tracking how offline engagement turns into online dollars. This is where dynamic QR codes become your secret weapon, especially when you use them on things like our QR Code Stickers.
Unlike a static QR code that points to one fixed link forever, a dynamic code’s destination can be updated anytime. More importantly, it tracks scan data. This lets you measure engagement from physical assets with the same precision you get from a digital ad.
Real-World QR Code Tracking Scenarios:
On Product Packaging: A coffee roaster puts a dynamic QR code sticker on their bags. When scanned, it takes customers to a page with brewing tips and a 10% discount on their next online order. By tracking scans and code redemptions, they can measure repeat purchases driven directly from their packaging.
At a Live Event: A band slaps a big QR code on a banner at their merch table. The code links to their Spotify page and an exclusive mailing list signup. They can see exactly how many new followers and subscribers they gained from that one event.
In-Store Retail: A boutique adds QR code stickers to clothing tags. Shoppers can scan to see a video of the item being styled or to read customer reviews. The retailer can then track scans to see which products get the most in-store digital engagement, helping them make smarter merchandising decisions.
By weaving these different tracking systems together, you build a comprehensive data-collection machine. It ensures that when you finally sit down to calculate ROI, you're working with a complete and accurate picture of what’s actually driving your business forward.
Choosing the Right Marketing Attribution Model
Once you have all your tracking set up, the real question emerges: how do you give credit for a sale when a customer interacts with five different marketing touchpoints over six months? This is where marketing attribution comes in. Think of it as the rulebook you create to assign value to each step of a customer’s journey.
Picking the right attribution model is absolutely critical for an accurate ROI calculation. A flawed model can trick you into undervaluing your most important channels while you keep pouring money into others that aren't actually pulling their weight. A B2B company with a year-long sales cycle, for instance, has completely different attribution needs than an e-commerce store selling t-shirts. Your model has to reflect your business reality.
The whole point is to move beyond simplistic, last-click thinking and get a complete view of how your entire marketing ecosystem works together to bring in revenue.
The Simplicity of Single-Touch Models
The most straightforward approaches are single-touch attribution models. They're popular because they’re easy to set up and understand, assigning 100% of the credit for a conversion to just one touchpoint.
First-Touch Attribution: This model gives all the credit to the very first interaction a customer had with your brand. It’s fantastic for figuring out which channels are best at generating initial awareness and filling the top of your funnel. If a customer first found you through a blog post, that blog post gets all the glory.
Last-Touch Attribution: On the flip side, this model gives all credit to the final touchpoint before the conversion. It’s really useful for identifying which channels are most effective at closing deals. If a customer clicked a Google ad right before buying, that ad gets the credit.
While simple, these models paint a wildly incomplete picture. They completely ignore the messy, multi-step journey most buyers actually take, which can lead to some seriously flawed decisions when you're trying to measure marketing ROI.
Relying solely on a last-touch model is like giving all the credit for a championship win to the player who scored the final point. It ignores the assists, defensive plays, and coaching that made the victory possible.
Adopting a More Balanced View with Multi-Touch Models
Multi-touch attribution models finally acknowledge that modern customer journeys are complex. Instead of giving one channel all the credit, they distribute it across multiple touchpoints, giving you a much more balanced and realistic assessment of your marketing performance.
Each model spreads the credit differently, so you can pick the one that best fits your business logic and typical sales cycle.
Linear Attribution
The Linear model is the most democratic of the bunch. It splits credit equally among every single touchpoint in the customer's path. If someone saw a social media post, opened an email, attended a webinar, and then hopped on a sales call before buying, each of those four touchpoints gets 25% of the credit.
This is a great first step away from single-touch models because it values every interaction. The only downside is it assumes all touchpoints are equally important, which is rarely true.
Time-Decay Attribution
The Time-Decay model gives more credit to the interactions that happened closer to the sale. The touchpoints that occurred weeks or months ago get less credit, while the ones right before the purchase get the most.
This model is especially effective for businesses with shorter consideration phases, like a direct-to-consumer brand. It rightly recognizes that the final marketing messages often have the biggest impact on the decision to buy.
Position-Based Attribution
Often called the "U-Shaped" model, Position-Based attribution gives the most weight to the first and last touches, then distributes the rest among the interactions in the middle. A common split is 40% to the first touch (for creating the lead), 40% to the last touch (for closing it), and the remaining 20% spread evenly across everything in between.
This hybrid approach is a favorite for many businesses because it values both generating the initial lead and sealing the deal. By getting familiar with these different models, you can more accurately measure your marketing ROI and make much smarter, data-backed decisions about where your budget will get the best results.
Calculating ROI for Different Marketing Channels

While the basic ROI formula is a solid foundation, applying it is far from a one-size-fits-all affair. Let's be real: you can't measure the ROI of a long-haul SEO strategy the same way you would a weekend PPC blitz.
Each marketing channel operates on its own timeline, with its own unique costs and ways of generating value. To get a true sense of your marketing performance, you have to get granular and adapt your approach for each one. That means digging into the hidden costs beyond ad spend and getting smart about how you attribute revenue, especially for channels that play the long game.
Nailing Down ROI for PPC Campaigns
Pay-per-click advertising is probably the most straightforward channel for calculating ROI. The line between what you spend and what you make is usually crystal clear. You pay for clicks, and those clicks—ideally—turn into sales pretty quickly.
Your main cost is obviously the ad spend. But to get a full picture, you need to loop in a few other expenses:
- Management Fees: Are you paying an agency or a freelancer? That's a cost.
- Creative Production: Don't forget the time and money spent designing visuals and writing ad copy.
- Tool Subscriptions: Factor in any bid management or specialized analytics software you're using.
Revenue comes from the conversion goals you've set up in platforms like Google Ads or Meta. For an e-commerce store, this is a direct purchase. If you're B2B, you might assign a dollar value to a demo request form based on your average lead-to-close rate and customer lifetime value.
A Quick PPC ROI Example:
Let's say a B2C company spends $5,000 on Google Ads in a month, which generates $20,000 in direct sales.
ROI = ($20,000 - $5,000) / $5,000 = 3
Multiply that by 100, and you've got a 300% ROI.
Decoding ROI for Content Marketing and SEO
Here’s where things get tricky. Content and SEO are marathons, not sprints. A blog post you publish today might not drive any meaningful revenue for six months or more, but its value can compound for years.
The costs are more than just a line item. You need to account for:
- Creator Salaries: The cost of your in-house writers, editors, and strategists.
- Freelancer/Agency Fees: Any outside help you bring in for content.
- Software and Tools: SEO platforms like Ahrefs or Semrush, plus your CMS costs.
- Promotional Spend: Any budget you put behind promoting the content.
Attributing revenue is where you have to think beyond last-click. Look at assisted conversions in Google Analytics. How many customers read a blog post or downloaded a guide before they eventually converted through another channel? By giving partial credit to these earlier touchpoints, you start to see the real financial impact of your content efforts.
The Staggering ROI of Email Marketing
Email marketing consistently boasts some of the highest returns out there. When you have a direct, permission-based line to an engaged audience, your costs stay low while your revenue potential soars. It's not uncommon to see benchmarks showing a $38 return for every $1 invested.
Your main costs are the monthly fees for your email service provider (ESP)—think Mailchimp or Klaviyo—plus the time your team spends building and sending the actual emails.
Calculating revenue is often as simple as tracking sales from clicks within a campaign. For a deeper analysis, you can calculate the Revenue Per Subscriber (RPS) over a specific period. This helps you understand the health and overall value of your list, not just a single campaign.
Email ROI in Action:
An e-commerce shop spends $1,000 total on their ESP and content for the month. They send one campaign that brings in $30,000 in sales.
ROI = ($30,000 - $1,000) / $1,000 = 29
That’s a massive 2,900% ROI.
Measuring the True Impact of Social Media
Social media often gets labeled a "brand-building" tool, which can be a cop-out for not measuring its financial impact. But it can absolutely be a revenue driver if you track beyond vanity metrics like likes and shares.
Your costs will include things like:
- Ad Spend: For boosted posts and paid social campaigns.
- Management Tools: Platforms like Buffer or Hootsuite.
- Team Salaries: The portion of your team's time dedicated to social.
- Creator/Influencer Partnerships: Any fees you pay out for collaborations.
You can track revenue directly through platform shopping features or by using UTM-tagged links in your posts and bio. For instance, if you're promoting a QR code sticker campaign on Instagram, a unique, trackable link in your bio can attribute every single sale back to that specific social push. This is how you transform social media from a fuzzy brand-awareness channel into a measurable sales engine.
The pressure to prove this kind of value is only growing. The market for advertising effectiveness measurement is projected to leap from $4.6 billion to $16.4 billion by 2034, with AI playing a huge role. In fact, you can find out more about how advertisers are seeing a 76% ROI uplift with AI in this detailed advertising effectiveness and ROI measurement market report.
Channel-Specific ROI Calculation Guide
To bring it all together, remember that what you measure depends entirely on where you're spending your money. Here’s a quick-glance table to help you frame your ROI calculations for different channels.
| Marketing Channel | Common Costs to Include | Key Revenue/Value Metrics | Sample ROI Benchmark |
|---|---|---|---|
| PPC Advertising | Ad Spend, Management Fees, Tool Subscriptions, Creative Costs | Direct Sales, Lead Value (e.g., Value per Demo Request) | 200% (2:1) is good, 400%+ (4:1) is excellent |
| SEO & Content | Salaries, Freelancer Fees, SEO/CMS Tool Costs, Link Building | Organic Traffic Revenue, Assisted Conversions, Lead Value | Highly variable; often negative in Year 1, positive long-term |
| Email Marketing | ESP Platform Fees, Team's Time/Salaries for Creation | Direct Sales from Campaigns, Revenue Per Subscriber (RPS) | 3,800% (38:1) is a widely cited industry average |
| Social Media | Ad Spend, Tool Subscriptions, Influencer Fees, Team Salaries | Social Commerce Sales, Tracked Conversions from Links | Varies wildly by platform and goal (brand vs. direct response) |
This table isn't exhaustive, but it provides a solid framework. The key takeaway is to be thorough with your costs and strategic with how you assign value to outcomes. The more detailed you are, the more trustworthy your ROI figures will be.
Taking Your ROI Measurement to the Next Level

Once you’ve got the hang of basic ROI calculations, you’ll quickly hit a wall. Standard formulas and attribution models are a great start, but they don't tell the whole story. They often miss the nuanced, complex ways your marketing truly influences customer behavior.
To really get ahead, you need to move beyond simply reporting on past campaigns and start strategically shaping future ones. That means adding some more sophisticated methods to your arsenal.
These advanced techniques help you tackle the really tough questions. How do you measure the value of a TV ad that no one can click on? How do you prove your ads are actually creating new customers, not just taking credit for sales that were going to happen anyway? This is where you graduate from direct attribution to measuring real business impact.
Seeing the Big Picture with Marketing Mix Modeling
One of the most powerful tools for a high-level view is Marketing Mix Modeling (MMM). Instead of trying to follow individual customer journeys, MMM uses heavy-duty statistical analysis on historical data to see how various marketing and non-marketing factors contribute to your overall sales. It’s a macro-level approach that helps untangle the complex web of influences on your bottom line.
A good MMM analysis pulls in data from everywhere:
- Your Marketing & Sales Data: This includes ad spend across every channel (online and offline), promotional calendars, and even pricing adjustments.
- External Factors: It also accounts for things you can't control, like seasonality, broader economic trends, what your competitors are doing, and even the weather.
By processing all this information, the model can isolate the specific "lift" in sales that can be attributed to each marketing channel. It’s especially brilliant for measuring the impact of hard-to-track, top-of-funnel activities like brand awareness campaigns on TV, radio, or in print.
MMM is your best friend for a holistic view. It helps you understand diminishing returns—that point where pumping more money into a channel stops giving you a proportional lift—so you can optimize your entire budget for maximum impact.
Proving Your Ads Really Work with Incrementality Testing
While MMM gives you the 30,000-foot view, incrementality testing (sometimes called lift analysis) gets laser-focused. Its entire purpose is to answer one crucial question: did my marketing cause this sale, or did I just pay to advertise to someone who was already on their way to buy from me?
The method is a classic scientific experiment. You split your audience into two groups:
- Test Group: These are the people who see your marketing campaign (your ads, emails, etc.).
- Control Group: This group is intentionally held back and does not see your campaign.
Once the campaign is over, you compare the conversion rates of both groups. That difference, or "lift," represents the incremental impact of your ads. These are the sales you can say with confidence would not have happened without your marketing. This is the gold standard for proving the true, causal value of a campaign, particularly in the world of digital advertising.
Leaning into AI and Predictive Analytics
The future of measuring marketing ROI is undeniably tied to artificial intelligence (AI) and predictive analytics. These technologies are fundamentally changing the game from backward-looking reports to forward-looking strategy. Instead of just figuring out what happened last quarter, you can start forecasting what will likely happen next.
This level of sophisticated measurement is becoming non-negotiable. While a staggering 83% of leaders say proving ROI is a top priority, only 36% feel they can actually do it well, revealing a massive analytics gap. AI is stepping in to close this divide, with 80% of marketers already using it to work more efficiently and make smarter decisions. If you're curious, you can find more on this in some recent digital marketing statistics.
Common Questions About Measuring Marketing ROI
Even with a solid playbook, trying to pin down marketing ROI can feel like wrestling with a ghost. There are always tricky questions and practical challenges that pop up. Figuring out how to navigate these is what separates a basic report from genuinely useful insights you can build a strategy on.
Let's dig into some of the most common questions I hear from marketers and get you some clear, practical answers.
How Do I Measure ROI for Brand Awareness Campaigns?
This is the classic marketing headache. You can't just draw a straight line from a billboard to a sale, so what do you do? The key is to stop looking for direct sales and start tracking the leading indicators—the metrics that tell you your brand's presence is actually growing.
Instead of revenue, keep your eyes on things like:
- Share of Voice: Are people talking about you more than your competitors? Tools can help you track brand mentions across social media and the web.
- Branded Search Volume: A spike in people Googling your company name is a massive signal that your brand recall is improving.
- Direct Website Traffic: This is another great one. When people bypass search engines and type your URL straight into their browser, you know your name is sticking.
To put a dollar figure on it, you can estimate the earned media value. Basically, ask yourself what it would have cost to get that same level of exposure through paid ads. Over time, you'll start to see a pattern: when these awareness metrics go up, sales or high-quality leads tend to follow a few months later. That connection allows you to build a model and estimate a more concrete ROI.
What Are the Biggest Mistakes to Avoid?
It's incredibly easy to fall into a few common traps that can make your ROI calculations completely useless. Knowing what these pitfalls are ahead of time is half the battle.
Here are the mistakes I see marketers make over and over again:
- Using a flawed attribution model. Relying solely on last-click attribution is a huge one. It gives all the credit to the final touchpoint and totally ignores the crucial work your brand campaigns and early content did to get the customer there in the first place.
- Forgetting to include all costs. Your ROI will look amazing if you only count ad spend. But what about team salaries, software subscriptions, or agency fees? Forgetting these will give you a dangerously inflated number.
- Focusing only on short-term ROI. This is a recipe for disaster. It pushes you to pour money into quick-win channels while neglecting powerful long-term engines like SEO and brand building that deliver sustainable growth.
- Ignoring Customer Lifetime Value (CLV). Looking only at the first purchase seriously undervalues your acquisition efforts. A customer might only spend $50 on their first order but go on to spend $500 over the next year.
- Maintaining inconsistent data tracking. If your UTM parameters are a mess, your data is compromised from the start. Garbage in, garbage out.
If there's one single error to avoid, it's treating ROI measurement as a one-time report. It's not a historical document you create and file away. It should be a constant feedback loop that actively informs and refines your strategy.
How Often Should I Calculate and Report on ROI?
There's no single right answer here; it really depends on your sales cycle and the specific channel you're measuring.
For fast-paced channels like e-commerce PPC campaigns, you should be looking at performance on a weekly or even daily basis. You have to be nimble to optimize bidding and creative before you burn through your budget.
On the other hand, for long-term strategies like content marketing and SEO, a monthly or quarterly review makes far more sense. These efforts take time to gain traction. Checking their ROI too often will just lead to panicky, premature decisions.
My advice is to establish a rhythm. Report on tactical, channel-specific ROI weekly or monthly with your marketing team. Then, present the bigger, more strategic ROI picture to leadership quarterly and annually to show how marketing is truly driving the business forward.
Ready to bridge the gap between your physical marketing and digital results? QR Code Stickers makes it easy to add trackable, dynamic QR codes to your products, packaging, and events. Turn every real-world interaction into a measurable data point and start proving your ROI today. Learn more at https://blog.qrcodestickers.net.
Article created using Outrank